Hi, my name is Sven and I am a Data Analyst / Project Manager.
During my time at Serviceplan group from early 2021 to end of 2022 I created and improved the Performance Management Dashboards in Tableau for a multinational car-manufacturer as well as trained BI Managers at an global publishing company in the art of data visualization in PowerBI. Afterwards I found a fullfilling project for a SME in the hotel industry. As a freelance data analyst I sucessfully transfered the BI Dashboards from Tableau to PowerBI. As a 1-man team I was responsible for the whole E2E Project, including Data Engineering and BI analysis. My endeavors started 2016 with learning and applying the classical Frontend Web-Development tech-stack Html, Css, JavaScript and modern Frameworks such as React, Gatsby, GraphQL. Previously I was able to collect valuable professional experience at Lufthansa.
Education: MBA in Technology and Management at TU Munich & Master in International Business Law at University of London (LLM).Main Expertise:
o Data Analytics:
Tableau / PowerBI (incl. MS Fabric, etc.): Data visualization and BI insight extraction
Python Pandas, Numpy, Scrapy, Seaborn, Matplotlib Excel, Dash/Plotly: gathering, cleaning, processing and visualizing data
o Data Science & Machine Learning:
Computer Vision and NLP with TensorFlow and Pytorch / fastAI
o Data Engineering
PostgreSQL, Snowflake, dbt, Azure, GCP and MongoDb: We collect, extract, transform and load data from everywhere.
The ocean is my great passion. Sailing between Greece islands, apnoe diving on Gili Islands, Indonesia or surfing waves - I love to be in, around and close to the ocean. Helping others at a local orphanage or organizing beach clean-up with ByeByePlasticBags Bali and all things sports-related fill up my spare-time when I'm not coding.
And as my projects below show - I love Bali and Indonesia and it became my second home.
Recent Works
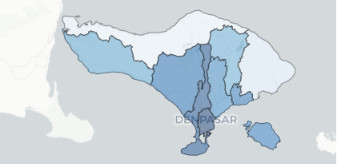
Collecting daily COVID-data from official sources, Dashboard Visualization with Plotly-Dash App deployed on Heroku: Displaying Regency Data for Bali with interactive comparison with other countries and indonesia provinces- made with Plotly, Scrapy, Python, Pandas - 2020

ResNet34 CNN trained on balinese dance-style images (500 images), accuracy 86% - made with fastai/pytorch, Python
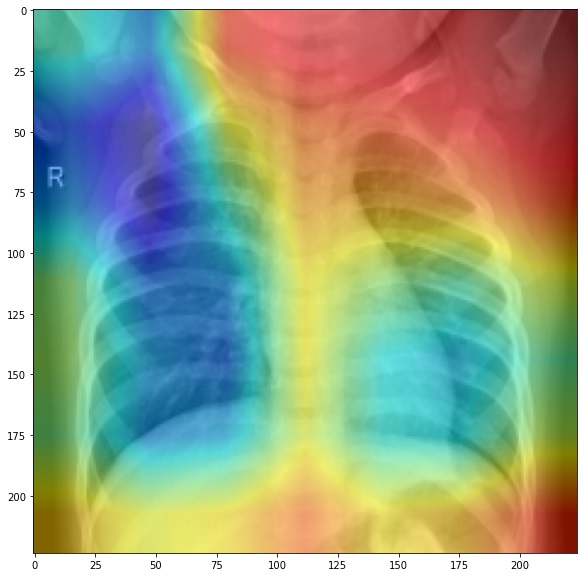
Image Recognition on lung x-rays to detect pneumonia, accuracy 72% - pytorch/fastAI
Explore all my public Tableau Projects
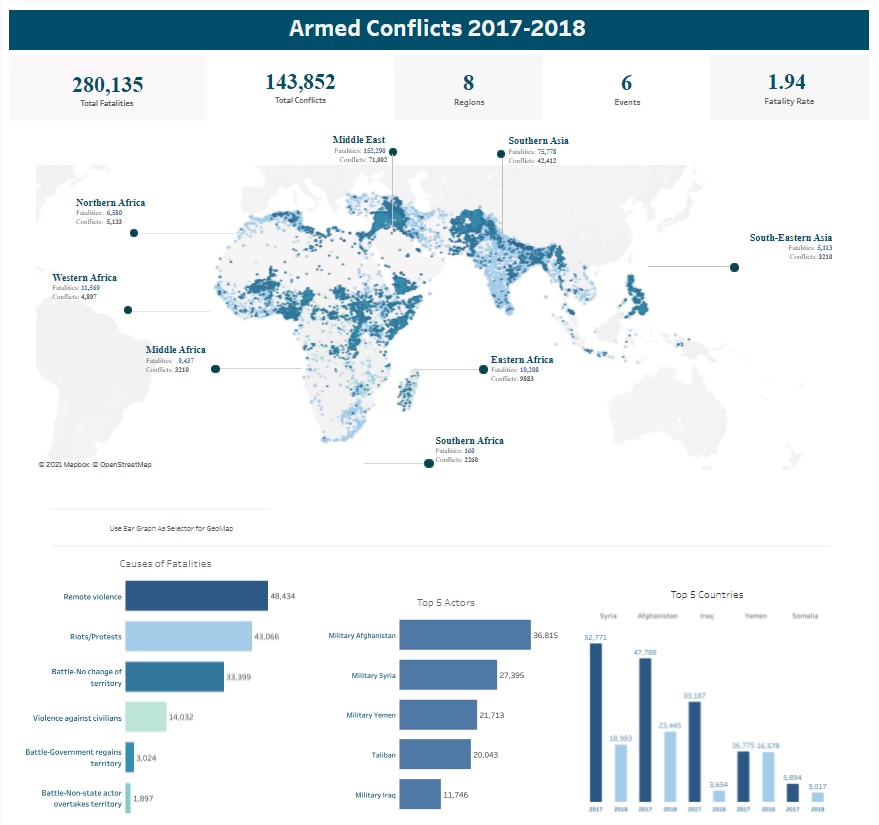
Statistical and Explorative Analysis of Financial Business Data with AI-Predictions for future Sales. Made with Tableau, Power Bi, FastAi-Pytorch and Python Plotly - 2021

ReactJS-GraphQl App displaying all launches of Elon Musks Space-X 2018

Detection of Pneumonia caused by COVID, with Scikit-learn and TensorFlow

Dataset 33.000 DICOM Images, pytorch, fastai, scikit-learn

Dataset created with python scrapy, processing with Pandas

Garmin Slope Detection App (MonkeyC)

next project coming soon

classic EDA of DNA Data, AI Image recognition, and Stock Data Visualization- made with Python, seaborn, pandas, yfinance

Animated visualization of US GDP - REST API, Javascript, D3 - 2017

made with Bootstrap, Html, Sass & some JS Animations

HTML / CSS / JS Site with anime.js and other animations